


Article Figures & Tables
Figures
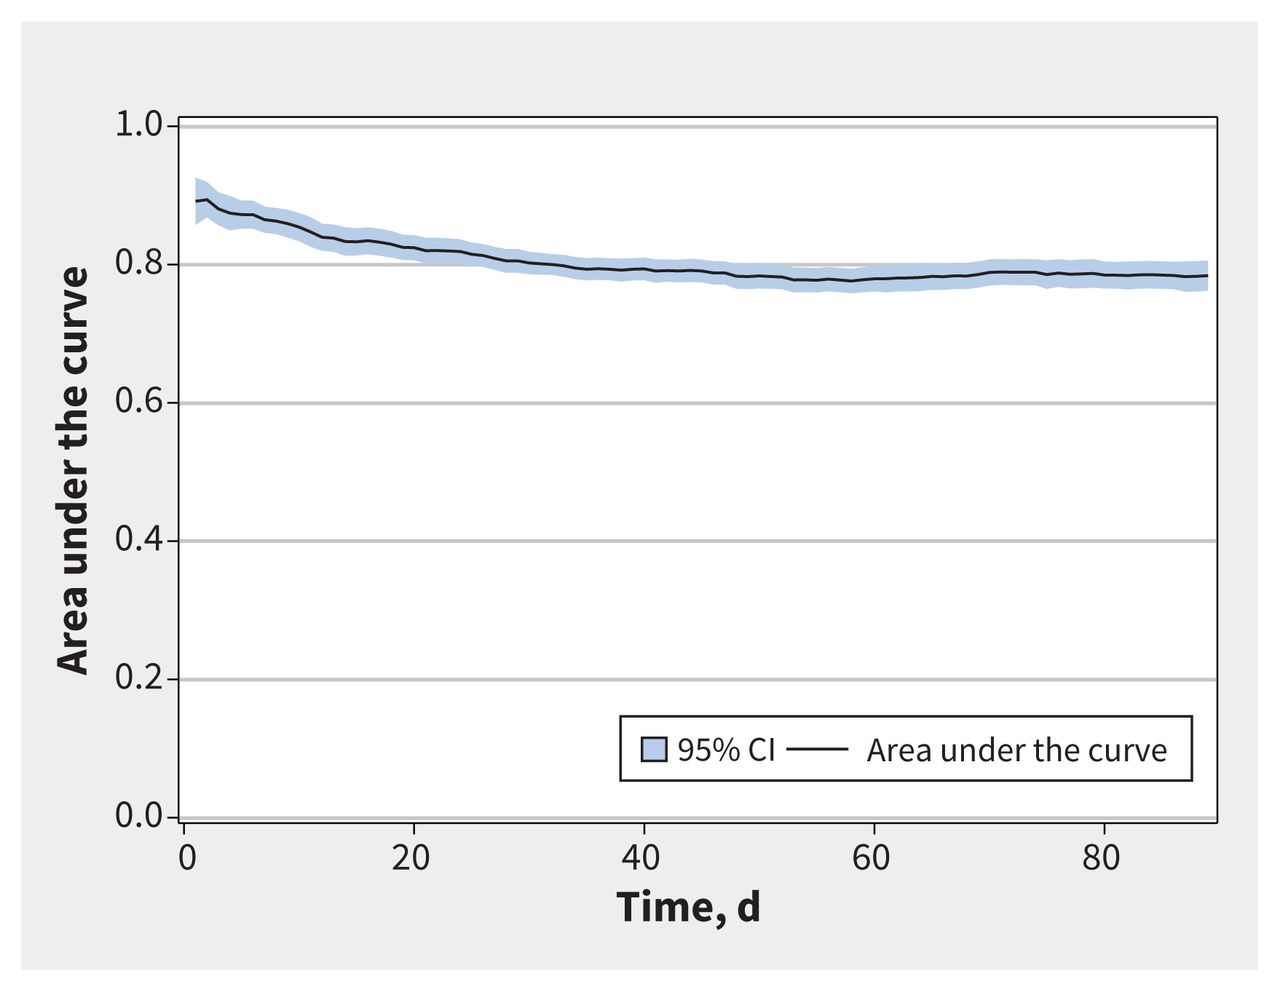
- Figure 1:
Continuous plot of area under the receiver-operating characteristic curve values against time, with 95% confidence interval (CI).
- Figure 2:
Calibration plots of observed (dots) versus predicted (dashed line) death or cardiac hospitalization on the waitlist at (A) 15, (B) 30, (C) 60 and (D) 90 days, according to vigintiles of risk.


Tables
- Table 1:
Baseline characteristics of patients who died or had unplanned cardiac hospitalizations while on the waitlist for cardiac surgery, compared with those who did not
Variable No. (%) of patients Standardized differences Event
n = 3033No event
n = 59 342Demographics Age, yr, mean ± SD 67.1 ± 10.3 66.3 ± 10.9 0.07 Age, yr, median (IQR) 68 (60–74) 67 (60–74) 0.05 Sex, female 756 (24.9) 15 626 (26.3) 0.03 BMI, kg/m2, mean ± SD, 28.56 ± 5.38 28.95 ± 5.56 0.07 BMI, kg/m2, median (IQR) 28 (25–31) 28 (25–32) 0.07 Rural residence 2619 (86.4) 50 619 (85.3) 0.03 Hospital type Community 379 (12.5) 14 953 (25.2) 0.33 Teaching 2654 (87.5) 44 389 (74.8) Waitlisted during inpatient encounter 770 (25.4) 2913 (4.9) 0.6 Comorbidities Hypertension 2662 (87.8) 49 488 (83.4) 0.12 Atrial fibrillation 418 (13.8) 7212 (12.2) 0.05 Recent myocardial infarction 437 (14.4) 2119 (3.6) 0.39 CCS classification 0 575 (19.0) 21 386 (36.0) 0.39 1 483 (15.9) 8805 (14.8) 0.03 2 569 (18.8) 14 989 (25.3) 0.16 3 603 (19.9) 11 828 (19.9) 0 4 163 (5.4) 1112 (1.9) 0.19 Low-risk acute coronary syndrome 360 (11.9) 858 (1.4) 0.43 Intermediate-risk acute coronary syndrome 260 (8.6) 339 (0.6) 0.39 High-risk acute coronary syndrome 20 (0.7) 25 (0.0) 0.1 Left main or left main equivalent disease 1311 (43.2) 18 319 (30.9) 0.26 Proximal LAD artery disease 1346 (44.4) 19 571 (33.0) 0.24 Previous percutaneous coronary intervention 375 (12.4) 6047 (10.2) 0.07 Left ventricular ejection fraction, % ≥ 50 2108 (69.5) 46 417 (78.2) 0.2 35–49 611 (20.1) 9367 (15.8) 0.11 20–35 273 (9.0) 3057 (5.2) 0.15 < 20 41 (1.4) 501 (0.8) 0.05 NYHA classification 1 2038 (67.2) 35 438 (59.7) 0.16 2 409 (13.5) 12 920 (21.8) 0.22 3 460 (15.2) 10 251 (17.3) 0.06 4 126 (4.2) 733 (1.2) 0.18 Heart failure 968 (31.9) 13 843 (23.3) 0.19 Moderate-severe mitral regurgitation 220 (7.3) 6951 (11.7) 0.15 Moderate-severe aortic regurgitation 69 (2.3) 2278 (3.8) 0.09 Severe aortic stenosis 687 (22.7) 18 980 (32.0) 0.21 Endocarditis None 3007 (99.1) 58 852 (99.2) 0 Acute 13 (0.4) 154 (0.3) 0.03 Subacute 13 (0.4) 336 (0.6) 0.02 Cerebrovascular disease 314 (10.4) 5451 (9.2) 0.04 Peripheral arterial disease 412 (13.6) 7942 (13.4) 0.01 Smoking status Never 1448 (47.7) 29 074 (49.0) 0.03 Current 604 (19.9) 9129 (15.4) 0.12 Former 981 (32.3) 21 139 (35.6) 0.07 Chronic obstructive pulmonary disease 795 (26.2) 13 111 (22.1) 0.1 Diabetes 1435 (47.3) 23 204 (39.1) 0.17 Dyslipidemia 2116 (69.8) 39 600 (66.7) 0.07 GFR, mL/min/1.73 m2, mean ± SD 82.0 ± 35.2 86.2 ± 34.1 0.12 GFR, mL/min/1.73 m2, median (IQR) 79 (58–103) 82 (62–105) 0.11 Dialysis 90 (3.0) 1074 (1.8) 0.08 Anemia 197 (6.5) 2344 (3.9) 0.11 Liver disease 37 (1.2) 561 (0.9) 0.03 Alcohol abuse 43 (1.4) 509 (0.9) 0.05 Dementia 47 (1.5) 656 (1.1) 0.04 Depression 51 (1.7) 415 (0.7) 0.09 Psychosis 6 (0.2) 70 (0.1) 0.02 Primary cancer 150 (4.9) 2887 (4.9) 0 Metastatic cancer 18 (0.6) 287 (0.5) 0.02 Operative characteristics Surgery type CABG 2091 (68.9) 30 481 (51.4) 0.36 Valve 500 (16.5) 18 781 (31.6) 0.36 CABG + valve 415 (13.7) 7518 (12.7) 0.03 Thoracic vorta 27 (0.9) 2562 (4.3) 0.22 Redo sternotomy 131 (4.3) 2047 (3.4) 0.05 Cardiogenic shock 1–5† 56 (0.1) 0.01 Operative priority Urgent 988 (32.6) 20 296 (34.2) 0.03 Semiurgent 844 (27.8) 11 180 (18.8) 0.21 Elective 1201 (39.6) 27 866 (47.0) 0.15 Wait time characteristics Recommend maximum wait time, d, mean ± SD 41.3 ± 31.0 43.7 ± 34.2 0.07 Recommend maximum wait time, d, median (IQR) 31 (14–62) 40 (14–71) 0.05 Adherence to recommended wait time‡ 1999 (65.9) 31 126 (52.5) 0.28 All-cause ED visits while on the waitlist, mean ± SD 0.3 ± 0.6 0.1 ± 0.5 0.28 All-cause ED visits while on the waitlist, median (IQR) 0 (0–0) 0 (0–0) 0.35 All-cause outpatient physician visits while on the waitlist, mean ± SD 1.0 (1.5) 2.1 (1.8) 0.63 All-cause outpatient physician visits while on the waitlist, median (IQR) 1 (0–2) 2 (1–3) 0.75 Note: BMI = body mass index, CABG = coronary artery bypass grafting, CCS = Canadian Cardiovascular Society, ED = emergency department, GFR = glomerular filtration rate, IQR = interquartile range, LAD = left anterior descending, NYHA = New York Heart Association, SD = standard deviation.
* Unless indicated otherwise.
↵† Data suppressed because of small cell size.
↵‡ Adherence is defined as adhering to the procedure-specific wait times recommended by the Canadian Cardiovascular Society Access to Care Working Group. (1)
- Table 2:
Multivariable predictors of patient death or unplanned cardiac hospitalization while on the waitlist for cardiac surgery
Variable HR (95% CI) p value Demographics BMI 0.99 (0.98–1.00) 0.004 Teaching v. community hospital 1.79 (1.56–2.05) < 0.001 Waitlisted during inpatient encounter 5.05 (4.48–5.70) < 0.001 Rural residence 0.86 (0.75–0.97) 0.02 Comorbidities CCS classification 0 Reference 1 1.59 (1.36–1.87) < 0.001 2 1.20 (1.02–1.40) 0.03 3 1.49 (1.27–1.75) < 0.001 4 2.74 (2.18–3.45) < 0.001 Low-risk acute coronary syndrome 6.01 (4.96–7.29) < 0.001 Intermediate-risk acute coronary syndrome 8.37 (6.68–10.49) < 0.001 High-risk acute coronary syndrome 8.08 (4.81–13.56) < 0.001 Recent myocardial infarction 0.84 (0.72–0.97) 0.02 NYHA classification 1 Reference 2 0.72 (0.62–0.84) < 0.001 3 0.94 (0.8–1.09) 0.4 4 1.78 (1.4–2.26) < 0.001 Heart failure 1.4 (1.25–1.56) < 0.0001 Atrial fibrillation 1.26 (1.1–1.44) 0.0007 Diabetes 1.13 (1.03–1.24) 0.008 GFR, per 10 unit increase 0.98 (0.96–0.99) 0.003 Proximal LAD > 70% stenosis 1.11 (1.01–1.23) 0.03 Severe aortic stenosis 1.28 (1.08–1.52) 0.004 Endocarditis None Reference Acute 2.17 (1.16–4.08) 0.02 Subacute 0.79 (0.37–1.66) 0.5 Operative characteristics Surgery type CABG Reference Valve 0.33 (0.27–0.41) < 0.001 CABG + valve 0.61 (0.49–0.76) < 0.001 Thoracic aorta 0.16 (0.1–0.27) < 0.001 Operative priority Urgent 1.45 (1.24–1.69) < 0.001 Semiurgent 1.50 (1.34–1.68) < 0.001 Elective Reference Note: BMI = body mass index, CABG = coronary artery bypass grafting, CCS = Canadian Cardiovascular Society, CI = confidence interval, GFR = glomerular filtration rate, HR = hazard ratio, LAD = left anterior descending, NYHA = New York Heart Association.
In this issue

Article tools


Jump to section
Related Articles
Cited By...
More in this TOC Section
Similar Articles
Collections

